25 Mar 2019
Anthelmintic resistance in cattle
Johnathan Love and Mike Taylor explain several control and worming strategies to help prevent parasitic nematode infections in herds.

Figure 1. Worming treatments are mainly targeted at first-year and second-year grazers.
Grazing cattle are exposed to a variety of different gastrointestinal nematodes, with Ostertagia ostertagi and Cooperia oncophora reported as the most prevalent species in temperate regions, including the UK.

Parasitic nematode infections can affect all ages of cattle, but are mainly of clinical significance in young parasite-naïve calves in their first year at grass, or in second-year grazers (Figure 1). For these animals, several control and worming strategies have been advocated that have proved successful – particularly since the launch of the macrocyclic lactone (3-ML) class of anthelmintics, which now dominate the cattle “wormer” market.
For a while, the use of anthelmintics in sheep – but more recently in cattle – has been increasingly under threat due to nematode species becoming resistant to products in use.
Anthelmintic resistance is the heritable ability of a parasite population to tolerate a usually effective dose of an anthelmintic and usually manifests as survival to exposure at standard, recommended dose rates.
Although less of a problem in cattle than in sheep and goats, worldwide reports of resistance have increased over the past decade, with the majority involving resistance to the 3-ML class of compounds reported in New Zealand and Australia, parts of the US and some European countries.
In the UK, only a few cases have been reported with the intestinal species, C oncophora, which is the dose-limiting species for many of the actives in the 3-ML group. The “true” representation of resistance is difficult to assess and determine – mainly due to lack of robust methods for determining anthelmintic resistance and the use of insufficiently sensitive faecal egg counting techniques.
The situation has been further compounded by the many instances of treatment failures due to inadequate dosing as a result of underestimation of bodyweight, or ineffective product application techniques – particularly following the use of pour-on products.
Faecal egg counts
Faecal egg counts (FECs) give an indirect measure of worm burden present in livestock, since experimental studies have shown a weak, positive correlation between excreted egg numbers and actual worm burden present.
FECs are usually reported as the number of worm eggs per gram (epg) of faeces, and can aid in the decision-making process of what animals to treat and when. Several underlying factors can lead to variability in FEC data, including:
- fluctuation in egg excretion over time
- faecal consistency
- aggregation of eggs within faeces
- variation in the collection, storage and handling of samples
- differences in the biotic potential of different parasite species
FECs also do not distinguish between the main trichostrongyle nematodes species, whose eggs look very similar morphologically, and either larval culture and speciation or use of molecular probes is required to determine the species present.
FECs can also present many interpretational issues. For instance, a high FEC may be regarded as an indication of high worm burden, but takes no consideration of the fact species of nematode vary in fecundity and pathogenicity.
Faecal egg production also varies throughout the year and is greatly influenced by a number of factors, including levels of parasite challenge (which, in turn, is influenced by weather patterns), time of year (that is, seasonality) and the development of protective immunity in herds.
Equally, a low FEC does not necessarily equate to a low worm burden – especially if the parasite population comprises largely larval or hypobiotic worms. FEC methods vary between laboratories, either in sample sizes examined, methods of examination and method sensitivity. The McMaster method is the most widely used standard quantitative FEC technique and various modifications are reported in the literature. Reported methods differ in the:
- weight of faeces examined
- flotation solution used (that is, saturated salt, sugar, zinc sulphate, level of saturation and volume)
- flotation time
- presence or absence of a centrifugation step
- volume of faecal suspension counted in the McMaster slide (that is, two grids or two chambers)
- counting method and multiplication factors employed
- whether any correction factors are used to allow for faecal consistency
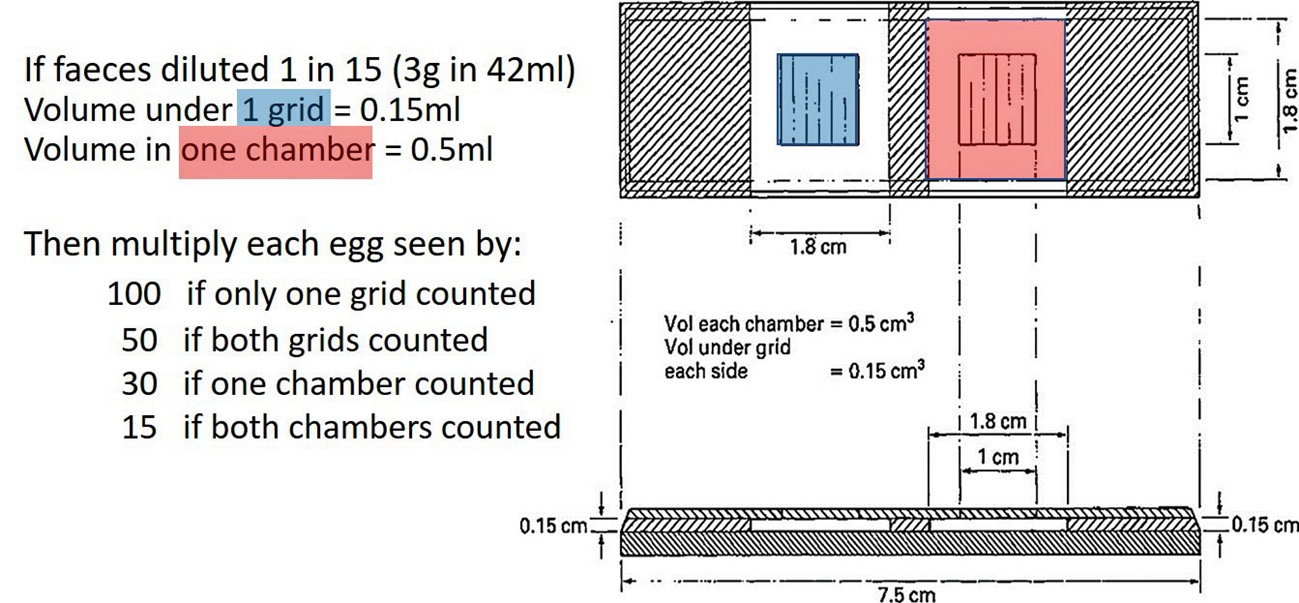
Diagnostic sensitivities of the McMaster methods typically range from 10epg to 100epg based on weight of faeces and dilutions used; and in the number (one or two) and areas of counting chambers (grid or whole chamber) examined. So, for example, with a 1 in 15 dilution (for instance, 3g faeces in 42ml salt solution), counting both grids has a sensitivity of 50epg while counting both chambers has a sensitivity of 15epg (Figure 2).
Greater sensitivities down to 1epg can be achieved using other more sensitive counting techniques, such as Flotac (Cringoli, 2006) or a sensitive centrifugal flotation technique (Ministry of Agriculture, Fisheries and Food, 1986).
Resistance detection methods
The method most commonly used to investigate suspected anthelmintic resistance in the field is the FEC reduction test (FECRT). However, this has never been fully validated for cattle and the European Medicines Agency regards this test as a means of evaluating drug efficacy, rather than confirmation of resistance. True resistance needs to be confirmed through slaughter trials, potentially supported by molecular level studies, or by in vitro methods such as egg hatch or larval development tests.
Guidelines have been published by the World Association for the Advancement in Veterinary Parasitology (WAAVP) outlining methods for the detection of anthelmintic resistance in ruminants (Coles et al, 1992; 2006). These guidelines offer thresholds to define “efficacy” and “resistance”; however, a lack of consensus exists in the published literature and within the industry as to how FECRTs should be calculated.
The WAAVP FECRT methodology was originally developed for use in sheep, and has been subsequently adapted, but not fully validated, for use in cattle. The guidelines recommend at least two treatment groups – an untreated control group and one or more treated groups – each comprising 10 to 15 animals. All animals included in the test should be shedding greater than 150epg.
These criteria are particularly problematic when conducting FECRT in cattle because the level of egg excretion is generally low and highly aggregated within groups of cattle – that is, most animals will be shedding only low numbers of eggs, with relatively few animals shedding large numbers of eggs. The guidelines also recommend use of the McMaster technique using a method sensitivity of 50epg.
Several studies have shown the more sensitive the FEC test method is (in epg), the more precise the determination of anthelmintic efficacy will be – particularly for cattle, in which nematode egg counts are usually much lower than seen in sheep or goats.
A study comparing three FEC techniques – Cornell-Wisconsin (1epg detection limit), Flotac (1epg) and McMaster (10epg) – across four levels of egg excretion found the Flotac method provided the most precise FECRT results and the other two gave similar imprecise results. It was noted, though, the precision of FECRT is affected by the methodology and that the level of egg excretion should be considered in the final FECRT interpretation (Levecke et al, 2012).
Determining anthelmintic efficacy
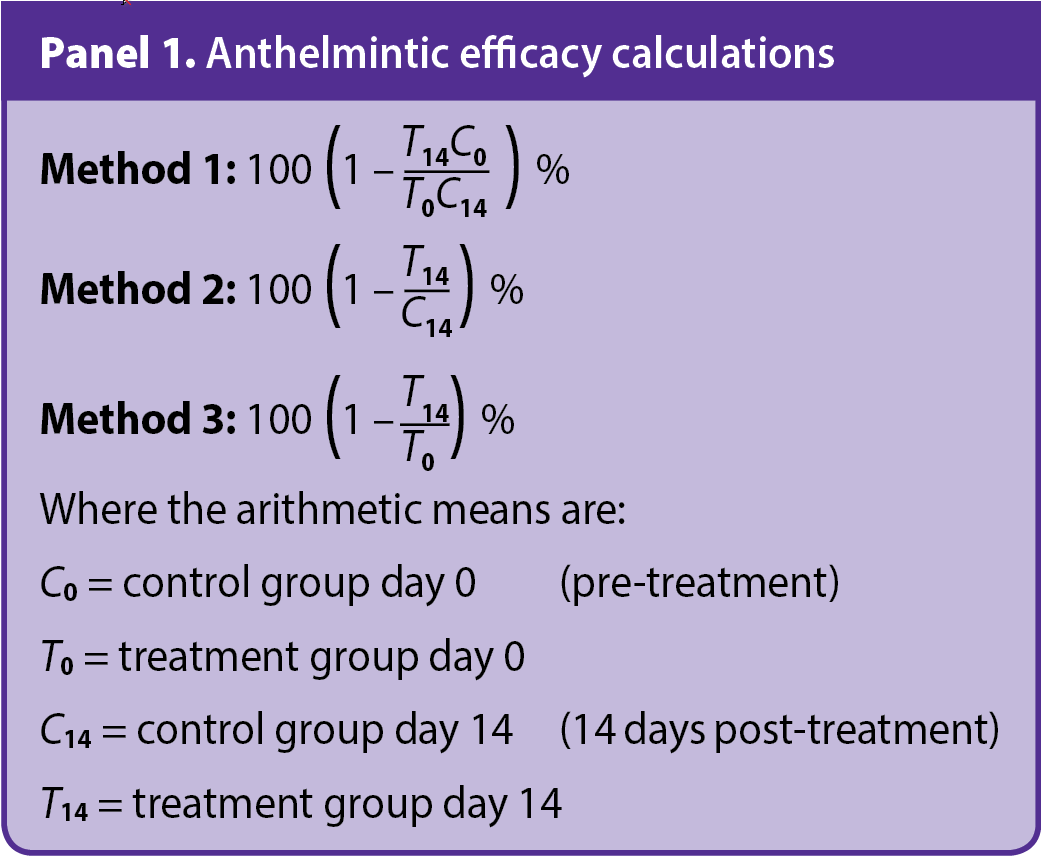
Anthelmintic efficacy by FECRTs can be calculated in several ways, such as by determining the arithmetic means of pre-treatment and post-treatment counts in control and treated groups (method 1); post-treatment counts only in control and treatment groups (method 2); or pre-treatment and post-treatment counts in a treatment group only (method 3).
Method 2 is the method recommended by the WAAVP, which also recommends evaluating a 95% confidence interval, assuming FECs follow a normal distribution. The formulae for efficacy calculations by each of the three methods are summarised in Panel 1.
WAAVP guidelines interpret resistance as “present” with a percentage reduction in egg count of less than 95% with a 95% lower confidence interval limit less than 90%. If only one of the two criteria is met, resistance is “suspected”.
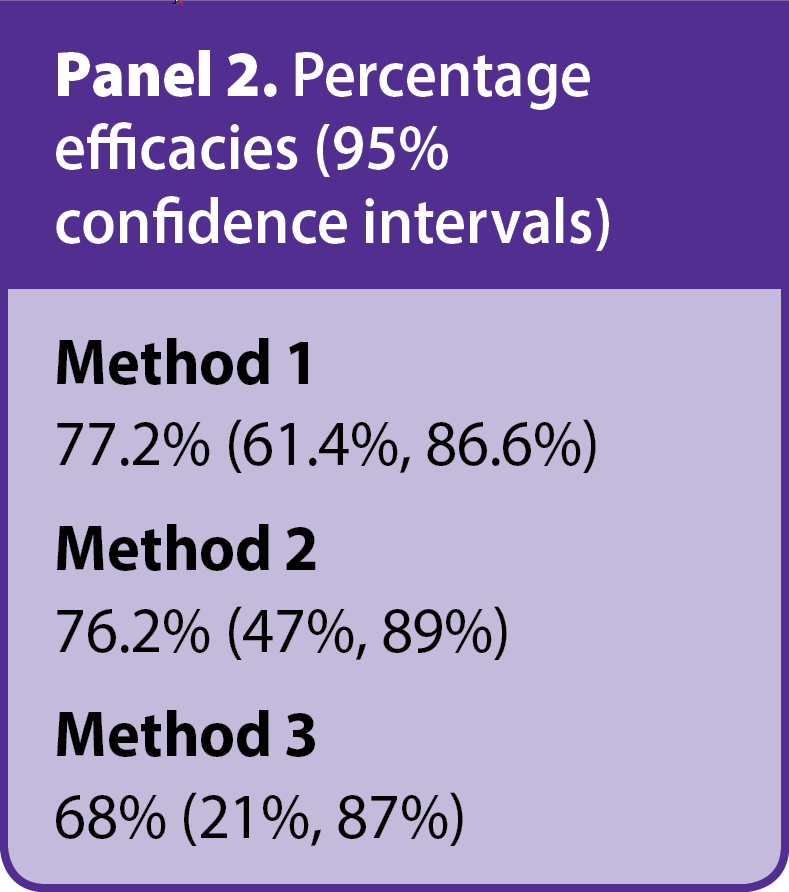
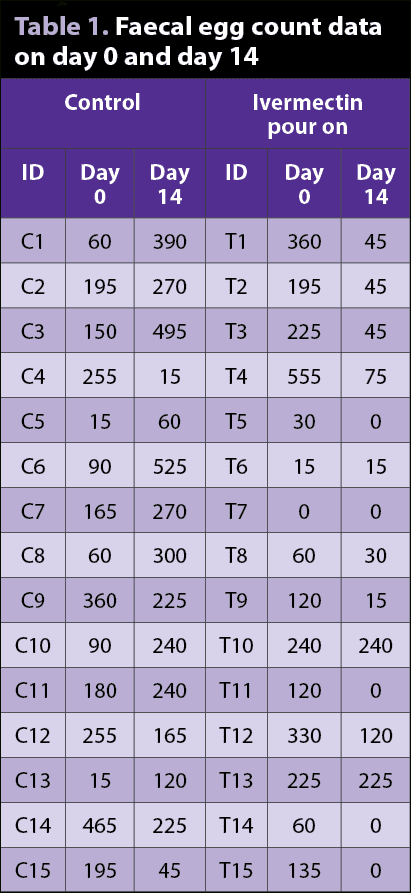
As a worked example, FEC (epg) data both pre-treatment and post-treatment for control and ivermectin pour-on treatment groups are shown in Table 1. FEC data were obtained using a modified McMaster with a sensitivity of 15epg. The percentage efficacy results for the treatment group, with 95% confidence intervals, for each of the three methods are shown in Panel 2.
As an example of interpreting such results, based on method 3, the true percentage efficacy is estimated as 68% and it is highly likely – that is, 95% of the time – the true percentage efficacy would be at least 21%, and at most 87%, if we were to repeatedly sample from the same population/carry out the experiment many times. By applying WAAVP criteria, all three methods suggest resistance based on these results.
Method 3 has great appeal – particularly when pour-on products are used, which risks cross-drug contamination of control animals, as all animals in a group can be treated. Also, since it avoids the need for a control group, the labour and costs involved are greatly reduced.
As part of ongoing VMD/Defra-funded projects and a PhD study, cattle FEC data that had been obtained from large-scale field studies in England were used in computer simulation studies using Bayesian methodologies. Previous research into the use of Bayesian methods to determine anthelmintic efficacy and possible resistance with equine FEC data – and, more recently, to a lesser extent, with cattle and sheep FEC data – has shown the Bayesian approach to analysing data offers many benefits. For instance, the usual normality assumption within statistical models/methods can typically be removed.
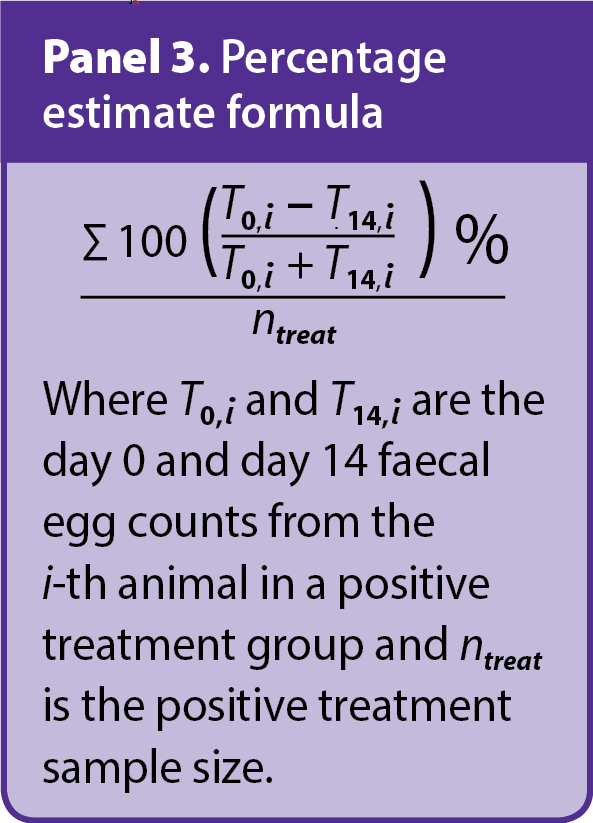
The study has been evaluating the robustness of a range of percentage reductions – that is, the accuracy of estimation of a range of percentage reductions, involving different sample sizes and diagnostic sensitivities. The percentage estimate (PE) that has been observed as the most accurate is highlighted in Panel 3. It is calculated by averaging over (that is, taking the mean value of) individual animals’ percentage reductions (referred to as the symmetrised percentage change; SPC) along with a credibility interval of 95% being obtained.
The approach of averaging over individual percentage reductions/changes involves each individual animal serving as its own control (that is, paired FEC data being obtained across days 0 and 14 from a treatment group) and has been considered in the past as part of statistical analyses involved with the FECRT, but little research has been dedicated to this concept.
The SPC can also offer many theoretical advantages, such as being bounded (that is, between ±100%). Having a bounded range means the influence of outliers in FEC data is greatly reduced. These outliers can adversely affect the mean values of animal groups, and it is often the case with cattle FEC data that a small number of individual animals will be shedding high numbers of eggs in their faeces.
This PE is recommended using a minimum number of 15 animals being present in the treatment group, and the FEC data determined using a McMaster method with a sensitivity of 15epg. This PE, along with a 95% credible interval, was found to give a better representation of what was observed with field study data, with respect to classifying “efficacy” or “lack of efficacy”.
However, when interpreting the PE and its associated 95% credible interval, other factors may also have to be considered, such as the need to identify and differentiate nematode species present in the samples using either a bulk culture and larval differentiation, and the seasonal succession of nematode species that may influence FECs and species composition at various times of the year.
For the treatment group data in Table 1, the PE was estimated as 84.8%, with a 95% credible interval of (58.5%, 99.8%). The associated interpretation of this result is the true percentage efficacy is estimated as 84.8% and that we can be 95% certain the true percentage efficacy is at least 58.5% and, at most, 99.8%. Note this is a different interpretation than that for a 95% confidence interval, previously presented. However, when applying WAAVP criteria, this result would still be suggestive of resistant nematodes being present.
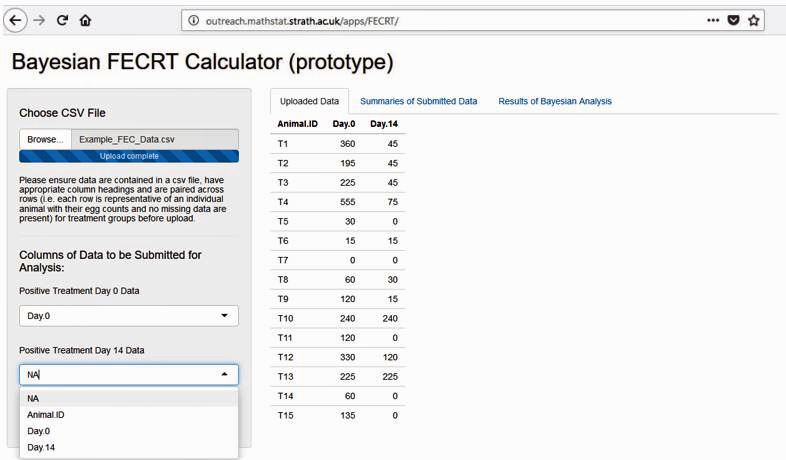
One drawback to using a Bayesian approach is the availability of modelling programs for use in the field. As part of the PhD project, a Bayesian FECRT Calculator prototype web page application (Figure 3) has been created, which can be used to carry out analyses of FECRT data using the developed Bayesian model. Visit https://bit.ly/2ERl7z3
Future development and funding would be needed to develop the model into a more user-friendly smartphone or tablet app, into which data could be entered directly from the field or laboratory.