18 Feb 2020
Capnography – a refresher
Becky Robinson
Job Title
Respiratory function monitoring can provide valuable information for patients undergoing anaesthesia or those that are critically ill.
The primary function of the respiratory system is to allow exchange of oxygen and carbon dioxide between the body and environment.
If not functioning optimally, the patient will suffer from reduced tissue oxygen delivery, with hypoxia and a buildup of carbon dioxide with resultant acidaemia.
While a variety of monitoring tools are available that give information on respiratory system function, it is important to remember basic, hands-on monitoring gives valuable information.
Occasionally, anaesthetic monitoring equipment will give artefactual information; basic monitoring is critical to distinguish this from what is really happening.
Visual assessment of the patient’s chest movements allows evaluation of the respiratory pattern, effort and rate.
Thoracic auscultation allows identification and location of abnormal lung sounds, indicating developing problems, including pulmonary oedema or aspiration (crackles), bronchoconstriction (expiratory wheezes) or pleural space disease (muffled lung sounds).
With anaesthetised patients, manual inflation of the lungs – by squeezing the reservoir bag with the adjustable pressure‑limiting valve closed – allows a crude assessment of the pulmonary compliance and inspiratory resistance. This also gives feedback regarding the presence of upper respiratory tract (endotracheal tube) obstructions or pleural space disease.
In recent years, it has become common for veterinary practices to have access to equipment that can monitor aspects of the respiratory system in more depth. A basic understanding of their function – and the relevance of the information provided – is important, otherwise the machine is, essentially, useless.
Capnography can be an extremely useful and versatile tool.
Carbon dioxide
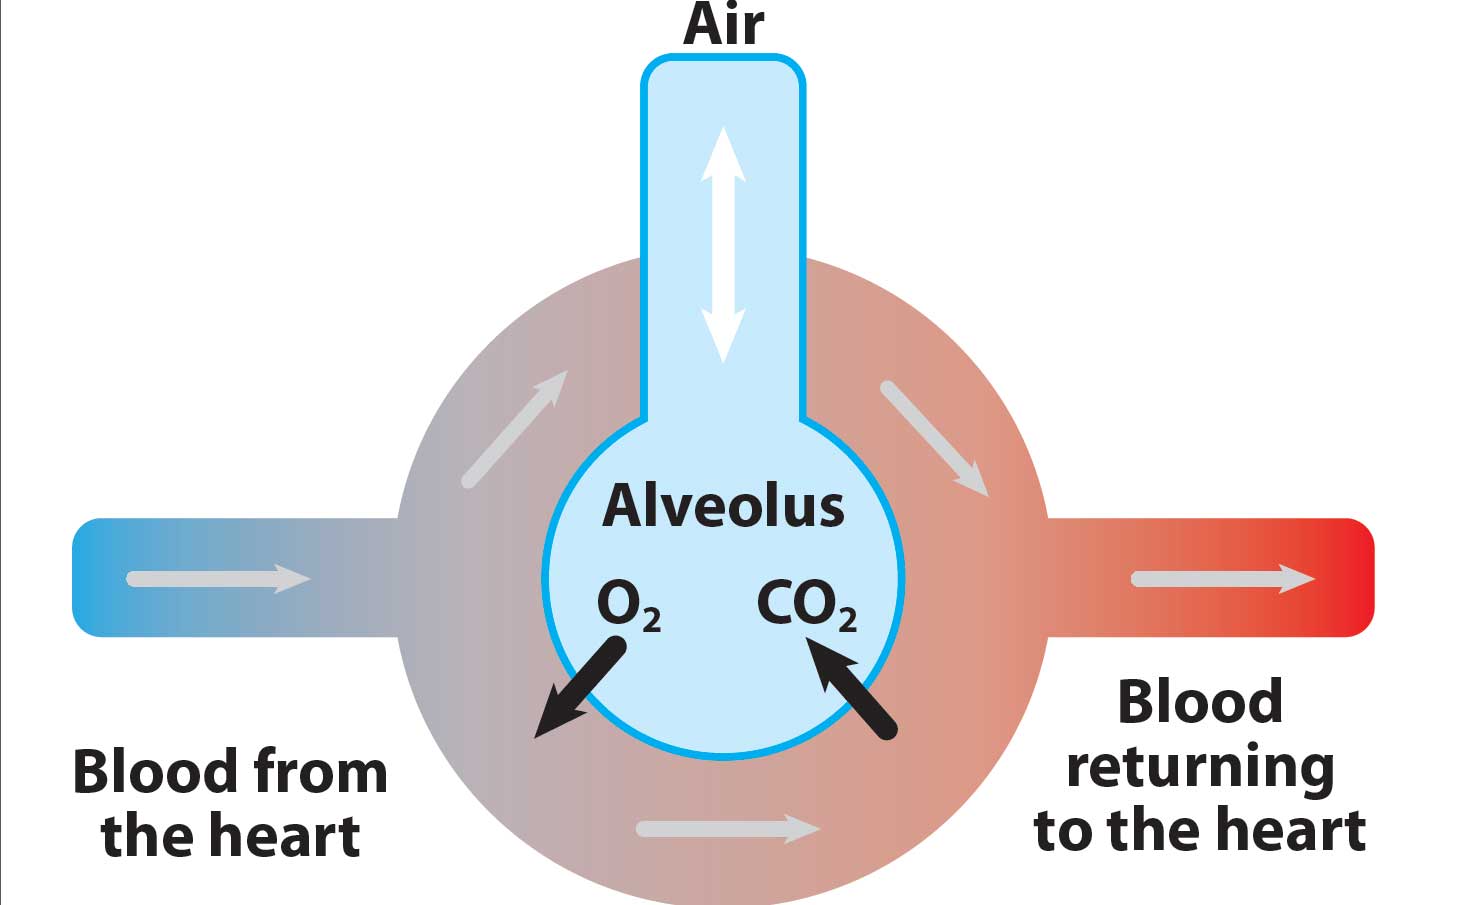
Carbon dioxide (CO2) is produced in the body’s cells as a result of metabolism and is carried to the lungs by the circulation. It is then removed by alveolar ventilation.
The concentration of CO2 that is expired is, therefore, determined by three factors (Figure 1):
- alveolar ventilation
- metabolism
- circulation
Capnography
Capnography is a “real time”, non-invasive measurement and numerical display of the CO2 concentration in the respiratory gases during breathing. It also measures the patient’s respiratory rate.
While both inspired and expired CO2 concentrations are measured and provide useful information, it is the expired concentration we are most interested in.
The peak expired CO2 concentration is referred to as end-tidal CO2 (ETCO2) and is usually displayed as a number with the measurement in mmHg. Alternative units of measurement include per cent or kilopascal.
This is taken to represent the alveolar partial pressure of CO2; in the healthy patient, this correlates well with the arterial partial pressure of CO2 (PaCO2), which would be expected to be only 2mmHg to 5mmHg higher.
When two of the three factors determining expired CO2 are stable, capnometry provides information on changes on the third. Capnometry can also give valuable information regarding our anaesthetic equipment (Langton et al, 2010).
Examples include:
- whether the endotracheal tube is correctly positioned and patent
- if leaks are present in the anaesthetic breathing system
- if the fresh gas flow is inadequate when using a non-rebreathing anaesthetic system
- whether the CO2 absorber is exhausted, or if one-way valves are malfunctioning when using a rebreathing anaesthetic system
Principles of measurement
Capnography units can either be mainstream analysers, with the sensor placed directly between the endotracheal tube and breathing system, or sidestream analysers (Table 1).
| Table 1. Comparison of the two main types of capnography units – mainstream and sidestream analysers | ||
|---|---|---|
| Mainstream analysers | Sidestream analysers | |
| Sensor position | Between the endotracheal tube and breathing system. | In the anaesthetic monitor, with a gas sample line drawing gas from a connector at the level of the endotracheal tube. |
| Advantages | • Rapid response time. • Better suited for patients with a fast respiratory rate and very small tidal volumes. |
• Doesn’t require endotracheal intubation for measurement. • Less dead space. • Units are less prone to damage. |
| Disadvantages | • Requires endotracheal intubation for measurement. • Unit creates increased dead space. • Prone to malfunction due to water vapour or dirt entering the unit. • Units tend to be expensive. |
• Slower response time; depends on the gas sampling rate (50ml/min to 200ml/min) • Requires a water trap to remove water vapour enabling a dry gas sample. • The gas sample requires scavenging or returning to the anaesthetic breathing system. |
Sidestream analysers are more common and require a gas sampling line attached to a connector near the endotracheal tube. Samples are drawn to the anaesthetic monitor for analysis. Water vapour is removed with a water trap prior to measurement, to prevent interference.
Endotracheal intubation is not a prerequisite for sidestream sampling as the gas sample line can be placed at the level of the nares, attached to an intranasal catheter or inside a face mask in non-intubated patients.
Nasal capnography has been shown to provide an acceptable alternative to arterial blood gas analysis in both sedated and conscious, critically ill dogs (Pang et al, 2007; Kelmer et al, 2009).
The gas is ideally sampled as close to the patient as possible to measure alveolar gas. Gas samples are generally taken at between 50ml/min and 200ml/min, which means a delay can exist from the patient taking a breath and it appearing on the capnogram.
A higher sampling rate reduces the response time of the monitor (it shortens the time between measurement and monitor output), but also means a larger part of the fresh gas flow is “lost” each minute.
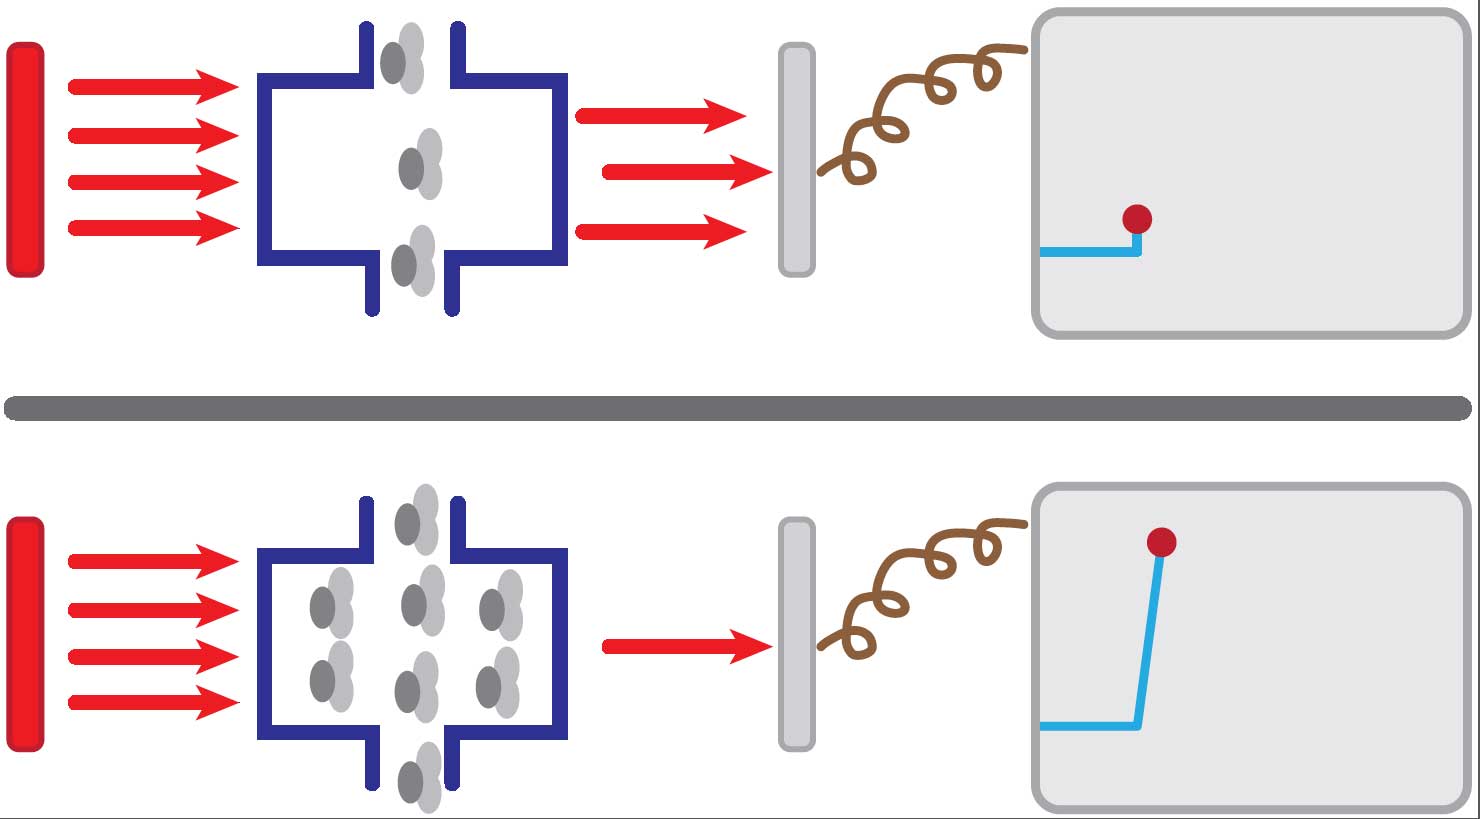
CO2 in respiratory gases can be measured in numerous ways. The majority of capnograms rely on the absorption of infrared light by CO2 molecules within the gases. The capnography unit produces infrared radiation, which passes through a gas sample chamber. The opposite side of the chamber has a photodetector.
The amount of radiation that reaches the photodetector depends on the concentration of CO2 within the chamber – the higher the concentration of CO2 in the chamber, the more radiation absorbed, with less falling on the photodetector, and vice versa (Figure 2).
Capnogram interpretation
Additionally to providing discrete numerical values of CO2 in respiratory gases, most capnography monitors also plot a capnogram. This is a diagrammatic representation of changes in CO2 over time. The basic components of the capnogram are illustrated in Figure 3.
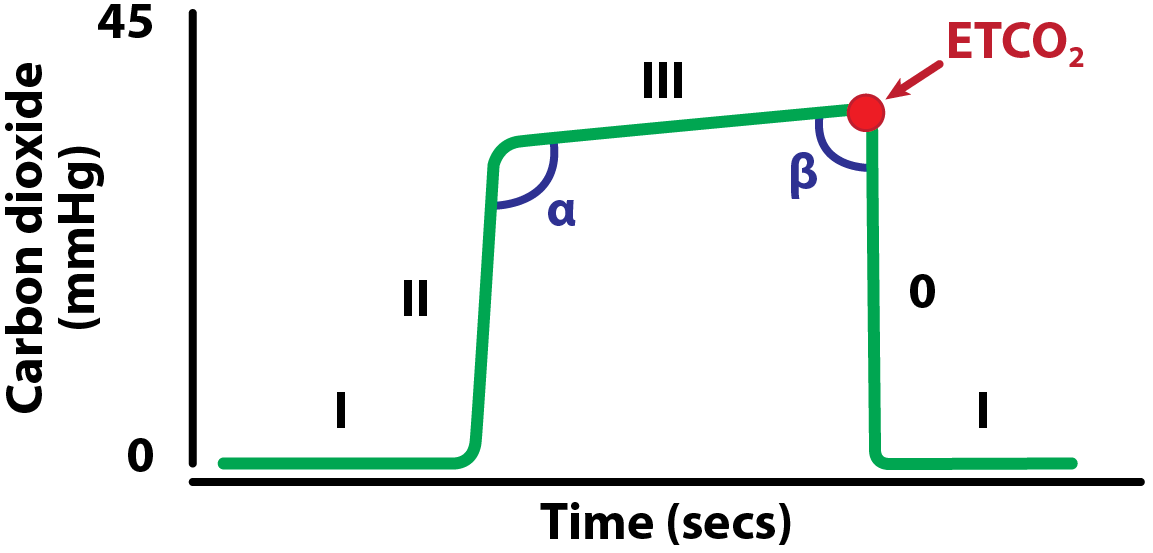
Phase I. Inspiratory baseline – this represents the analysis of the gases during inspiration and should be zero.
Phase II. Expiratory upstroke representing the beginning of expiration; the gases from the conducting airways (low carbon dioxide [CO2]) and alveoli (high CO2) mix during this phase, generating a steep increase.
Phase III. Expiratory (alveolar) plateau representing the exhalation of pure alveolar gas. This phase can be completely level, or a slight upward slope can be seen due to uneven emptying of the alveoli. The highest point on this plateau corresponds to the end tidal CO2 (ETCO2).
Phase 0. Inspiratory down stroke – the start of inspiration.
Alpha angle. The angle between phases II and III. This will increase as the slope of phase III increases. It is linked to variations in time constants within the lung (how quickly each part of the lung can fill and empty). The alpha angle is, therefore, an indication of the ventilation/perfusion status of the lung.
Beta angle. The angle between phase III and phase 0. This is normally nearly 90°. It can be used to assess the extent of rebreathing, during which an increase in the angle will be present.
As aforementioned, in most healthy dogs and cats, the ETCO2 is very similar to the concentration of gas in the arterial blood. Concentrations of CO2 are defined as:
- hypocapnia: less than 35mmHg
- normocapnia: 35mmHg to 45 mmHg
- hypercapnia: greater than 45mmHg
Mild hypocapnia can be desirable in patients with suspected intracranial disease where raised intracranial pressure could be a concern. Hypocapnia will induce cerebral vasoconstriction and, therefore, aid with a reduction of intracranial pressure via the Monro-Kellie doctrine. However, it is difficult to achieve without manual or mechanical ventilation.
In most patients, hypocapnia is not desirable as cerebral ischaemia can result. It is common for most anaesthetised patients – especially if spontaneously breathing – to be hypercapnic.
Although a deviation from normal, mild hypercapnia can have beneficial effects in most patients (Saghaei et al, 2014). However, CO2 concentrations greater than 60 mmHg should instigate changes in ventilation to reduce the ETCO2.
Reasons for increased and decreased ETCO2 are explained in Panel 1.
Increased ETCO2
- Decreased ventilation – for example, due to a low respiratory rate, reduced tidal volume or an increased dead space in the breathing circuit. Patient positioning and obesity can be a caused of hypoventilation.
- Increased production of CO2 – for example, occurring in hypermetabolic states and may indicate malignant hyperthermia, or severe fever.
- Increase in the inspired concentration of CO2 – for example due to rebreathing, may be due to exhausted soda lime or an external source of CO2.
Decreased ETCO2
- Gradual decrease:
- Increased alveolar ventilation
- Reduced CO2 production:
- hypothermia
- hypometabolic state
- Increased alveolar dead space – for example, hypotension due to low cardiac output, pulmonary embolism or high positive end-expiratory pressure during intermittent positive-pressure ventilation.
- Sampling error – for example, water blocking the sample line, inadequate tidal volume or a leaking endotracheal tube cuff.
- Sudden or complete decrease:
- Failure of ventilation – for example, apnoea, equipment blockage, disconnection or displacement.
- Failure of circulation – for example, cardiac arrest.
Capnogram examples
Using knowledge of the capnogram components and reasons for increased or decreased ETCO2, it is possible to use the capnogram trace to diagnose a variety of conditions. Common examples are illustrated in Figures 4 to 9.