25 Nov 2019
Why we should use capnography
Miguel Martinez details how to interpret a capnogram, as well as make the most of adopting this method in a clinical setting.
Miguel Martinez
Job Title
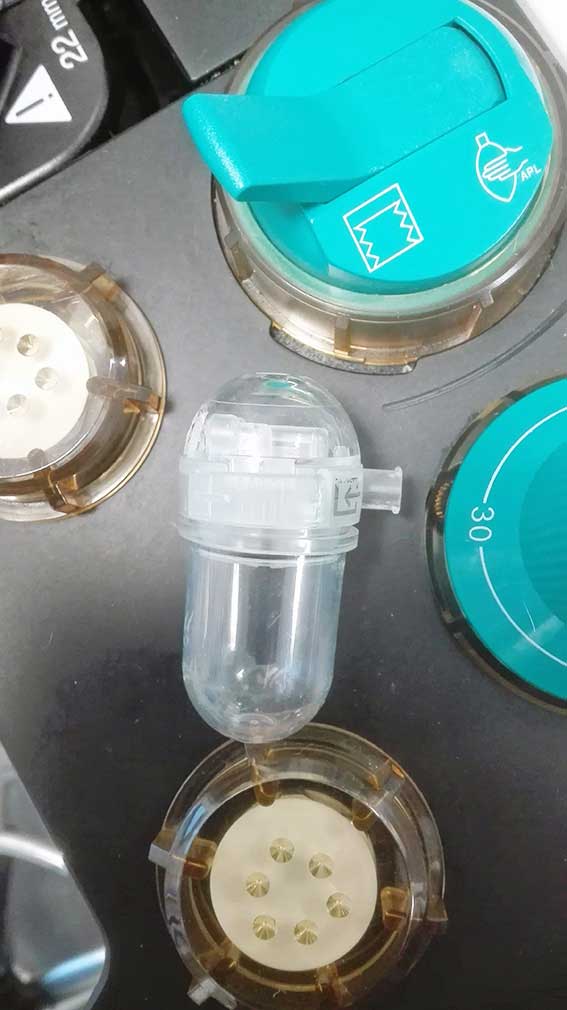
Mainstream capnography.
Capnography is a non-invasive method to measure and graphically represent exhaled CO2.
A small sample of exhaled gas (50ml/min to 200ml/min) is usually taken at the connection between the endotracheal tube and the breathing system. The analyser that measures exhaled CO2 is called a capnometer if it only provides a numerical value, or a capnographer when a graphic representation of the variation of exhaled CO2 over time is also available (a capnogram).
The capnogram is one of the most helpful tools to monitor anaesthetised patients. Capnographers also often provide measurements of respiratory rate and inspired fraction of CO2. Clinical research has shown the combination of capnography and pulse oximetry can detect more that 90% of the anaesthetic complications, hence reducing anaesthetic morbidity and mortality.
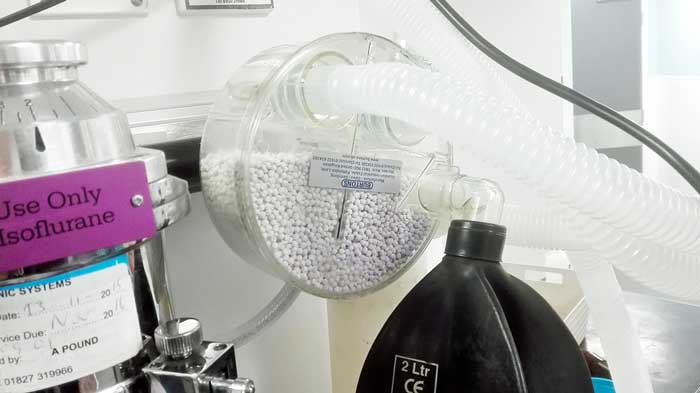
Capnographers can measure exhaled CO2 through several different methods – the most common being infrared absorption spectroscopy. This technology uses the different absorption of infrared radiation of the interatomic bond of molecules made of two different atoms (CO2, N2O, inhalant anaesthetics).
The measurement of exhaled CO2 by spectroscopy can, therefore, be artefactually affected by the presence of N2O and inhalant anaesthetics in the same gas mixture. This is due to the partial overlap of their infrared band width of absorption. Many modern analysers use a correction factor to minimise this potential source of error. Besides, the presence of water vapour can also lead to errors, hence the importance of using water traps and moisture filters.
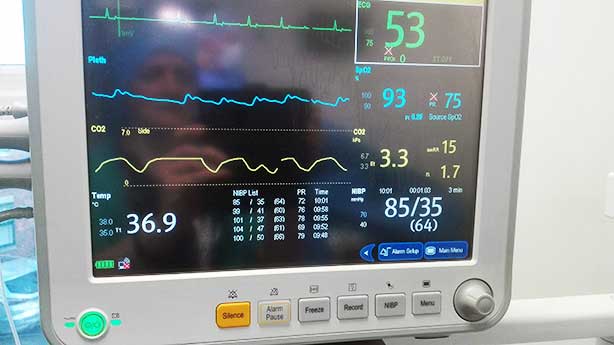
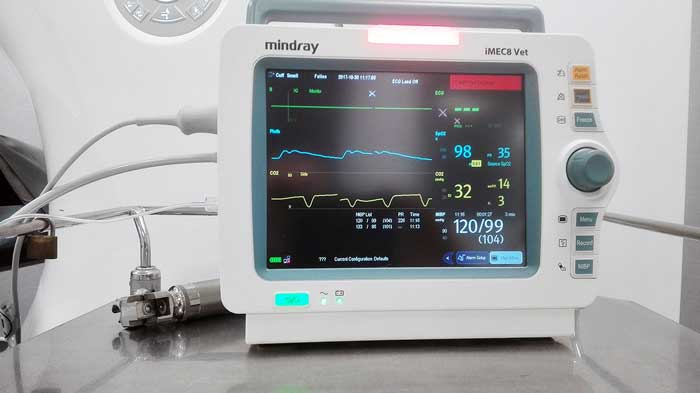
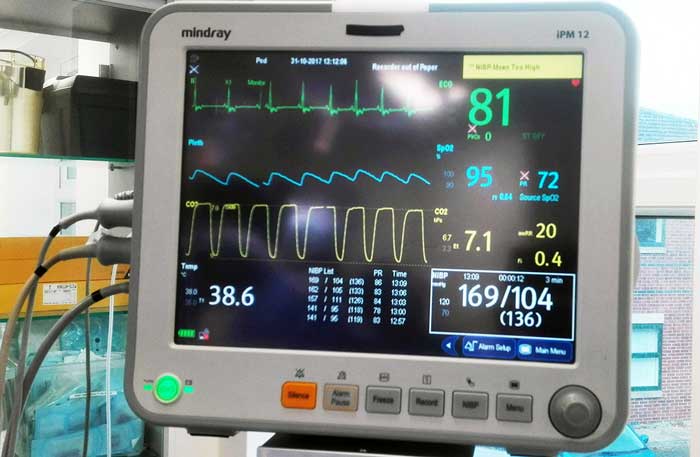
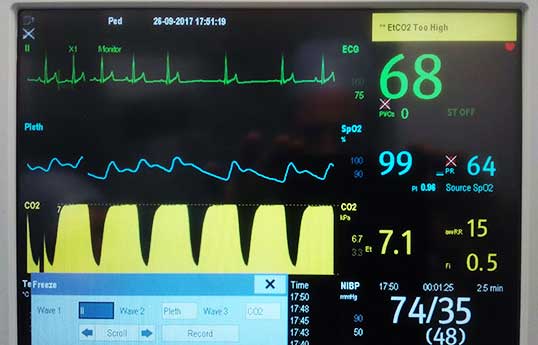
The highest numerical value obtained after each breath is called “end tidal” (ET) CO2. This is the partial pressure or concentration of CO2 captured by the analyser at the end of the expiratory phase of each breath. The international unit to measure partial pressure is kilopascal (kPa); however, many anaesthetists are yet more familiar with millimetres of mercury (mmHg) or percentage. The conversion factor from kPa to mmHg is ×7.5 (for example, 5kPa = 37.5mmHg).
The value of ETCO2 obtained at the connection of the endotracheal tube is normally very close to the one we would obtain if we were to take the sample from the pulmonary alveoli. In a similar way, the alveolar CO2 can be used as a close estimate of the partial pressure of CO2 in arterial blood (PaCO2) at the level of the pulmonary capillaries.
Under normal anaesthetic conditions it is expected that the CO2 alveolar-arterial difference is somewhere between 0.3kPa to 1.5kPa (2mmHg to 10mmHg). Any increase in ventilation-perfusion mismatch may lead to more pronounced alveolar-arterial difference (greater than 10mmHg). This is often the case in low cardiac output states and pulmonary thromboembolism.
The normal accepted range of ETCO2 is 4.5kPa to 6kPa (35mmHg to 45mmHg) in dogs and slightly lower in cats. This is what we call normocapnia. Values above this range are called hypercapnia (for example, hypoventilation under anaesthesia) and, conversely, hypocapnia occurs when ETCO2 is below 4kPa (35mmHg). Normocapnia is one of the requisites to maintain homeostasis.
Any variation of PaCO2 has an immediate effect on blood pH, leading to cardiovascular and metabolic alterations. More specifically, a tight control of ETCO2 is of critical importance in patients with raised intracranial pressure. Hypercapnia causes cerebral vasodilation leading to a further increase in intracranial pressure.
It has been aforementioned that CO2 measurements are taken at the connection between the endotracheal tube and the breathing system. However, in awake or non-intubated patients, ETCO2 can also be sampled from nasal prongs or catheters. The sample can be analysed directly at the site of sampling (mainstream capnography) or it is conducted through a length of fine plastic tubing to the analyser (sidestream capnography).
The analyser usually has an adjustable sample size between 50ml/min to 200ml/min depending on the size of the patient and the fresh gas flow used. It is recommended to use the shortest possible length of sampling line to minimise the delay between the patients breathing the capnograma appearing on the screen.
How to interpret a capnogram
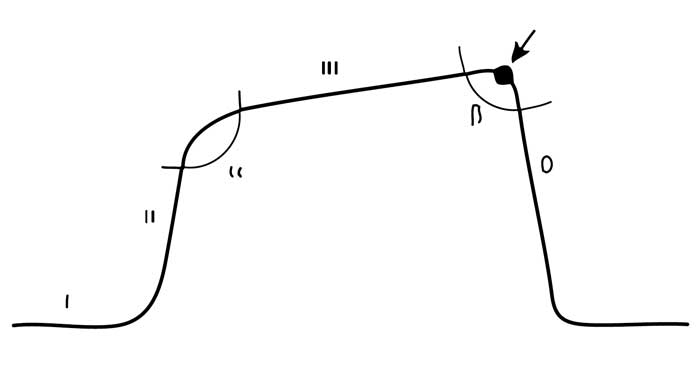
The conventional capnogram depicts the variation of exhaled CO2 at the point of sampling during the respiratory cycle. In the specific modality of volumetric capnography, the horizontal axis represents the exhaled volume instead of time.
Conventional capnography maximises its usefulness through meticulous analysis of the capnogram. The capnogram can be divided into four phases and has two angles.
Phase I: inspiratory baseline
The inspiratory baseline segment of the capnogram represents the amount of CO2 detected by the analyser during the inspiratory phase of a breathing cycle. It should normally be 0, but otherwise it detects the amount of CO2 rebreathing due to insufficient fresh gas flow, valve malfunction, soda lime exhaustion and so on.
Phase II: expiratory phase
The phase II segment marks the beginning of the expiratory phase. A gradual ascent of PCO2 exists due to mixing of anatomical and apparatus dead space gas, and gas from the alveoli containing a higher amount of CO2 due to capillary-alveolar transfer.
Phase III: expiratory plateau
The phase III segment coincides with alveolar emptying during expiration. The numerical value obtained at the end of expiration is called ETCO2, and it is used and reported as an approximation of PaCO2.
Phase IV: inspiratory phase
Phase IV marks the beginning of the inspiratory phase, with a rapid drop of CO2 down to 0 due to the entry of fresh gas, devoid of CO2, in the breathing system.
α angle
The α angle is between phase I and II.
Β angle
The Β angle is between phase III and IV.
Clinical use of capnography
To make the most of capnography in a clinical setting, we must have a good understanding of some basic physiological concepts.
CO2 is the waste product of glucose oxidation at a cellular level to obtain energy in the form of adenosine triphosphate. Excessive accumulation of CO2 in the body in the form of carbonic acid (H2CO3, HCO3– and H+) leads to a drop in pH (acidosis), which is detrimental for normal cellular function, hence the need of tight pH regulation. To achieve this, the CO2 resulting from glycolysis diffuses into the venous circulation and is transported to the lungs. Once in the pulmonary capillaries, it diffuses across the capillary-alveolar membrane to enter the alveoli. Finally, it is eliminated during the expiratory phase of breathing.
Capnography can identify variations in CO2 due to alterations at every level of the body.
CO2 production
- A gradual elevation of ETCO2 occurs when cellular metabolism increases (for example, hyperthermia).
- Conversely, ETCO2 progressively descends when cellular metabolism decreases (for example, hypothermia).
Cardiac output and pulmonary circulation
If the patient maintains a constant minute volume, such as in cases of mechanical ventilation, a drop in cardiac output will lead to a reduction in pulmonary blood flow and, consequently, a smaller amount of CO2 will be available to diffuse into the pulmonary alveoli. Logically, ETCO2 will decrease as a result reductions in cardiac output. Capnography is extremely useful in cases of hypovolaemia (for example, haemorrhage) and cardiac arrest. Conversely, an increase in cardiac output (for example, use of dobutamina, hyperdynamic phase of sepsis) will elevate ETCO2.
Respiratory system
The amount of exhaled CO2 is directly linked to the amount of gas that goes through the lungs per unit of time. This is called minute volume and is expressed in L/min. Hyperventilation, high minute volume, causes a decrease in ETCO2 as more CO2 is exhaled. This is called hypocapnia. The opposite is also true. Hypoventilation (reduced minute volume) leads to hypercapnia or increased CO2.
The capnogram can also detect changes in the breathing pattern, such as desynchronisation patient-ventilator and the return of spontaneous ventilation after use of neuromuscular blocking agents (called the curare cleft). If bronchospasm occurs, the α angle increases between phase I and II. We can also observe the variation in alveolar emptying cause by each heartbeat, called “cardiogenic oscillations”.
Equipment faults and technical issues
Capnography is extremely helpful to detect anaesthetic complications affecting the anaesthetic equipment and the airway, such as:
- oesophageal intubation
- patient disconnection from the breathing system
- malfunction of the unidirectional valves in a circle system
- anaesthetic gas leaks (deflated cuff)
- total or partial airway obstruction
- exhausted soda lime
- blocked water trap, water filter or sample line
It is worth mentioning specifically how determinant the use of ETCO2 is in the detection of cardiac arrest and monitoring of CPR manoeuvres. The most recent veterinary guidelines (Reassessment Campaign on Veterinary Resuscitation, 2012) advocate the use of ETCO2 to confirm cardiac-pulmonary arrest. A rapidly declining ETCO2 to near 0 in an intubated and ventilated animal is a strong indicator of cardio-pulmonary arrest. As we know, capnography is also a great tool to confirm endotracheal intubation necessary to perform adequate CPR.
Finally, ETCO2 can be used to estimate cardiac output and effective chest compressions during CPR. Research has shown that higher levels of ETCO2 during CPR are correlated with better outcomes. ETCO2 greater than 15mmHg during CPR is predictive of successful resuscitation.
Latest news
